What’s New in Cognos Analytics Dashboarding (12.1)
Posted by Corey Mendelsohn on September 25, 2025
Home - Blog - What’s New in Cognos Analytics Dashboarding (12.1)
If you’ve ever opened a BI tool and stared at an empty page wondering where to start, you’re not alone. The latest Cognos Analytics updates are built to remove that “blank canvas” moment. Whether you’re an analyst who lives in dashboards or an exec who hops in for quick answers, the new experience helps you go from question to insight—fast.
Why This Matters
Dashboards aren’t just pretty charts—they’re the front door to your data. When they’re easy to build and even easier to tweak, teams explore more, align faster, and make decisions with less back-and-forth. The result: fewer ad-hoc report requests, more self-service wins, and a BI footprint that actually scales.
Two Fast Ways To Get Started
(without starting from scratch)
![]()
![]()
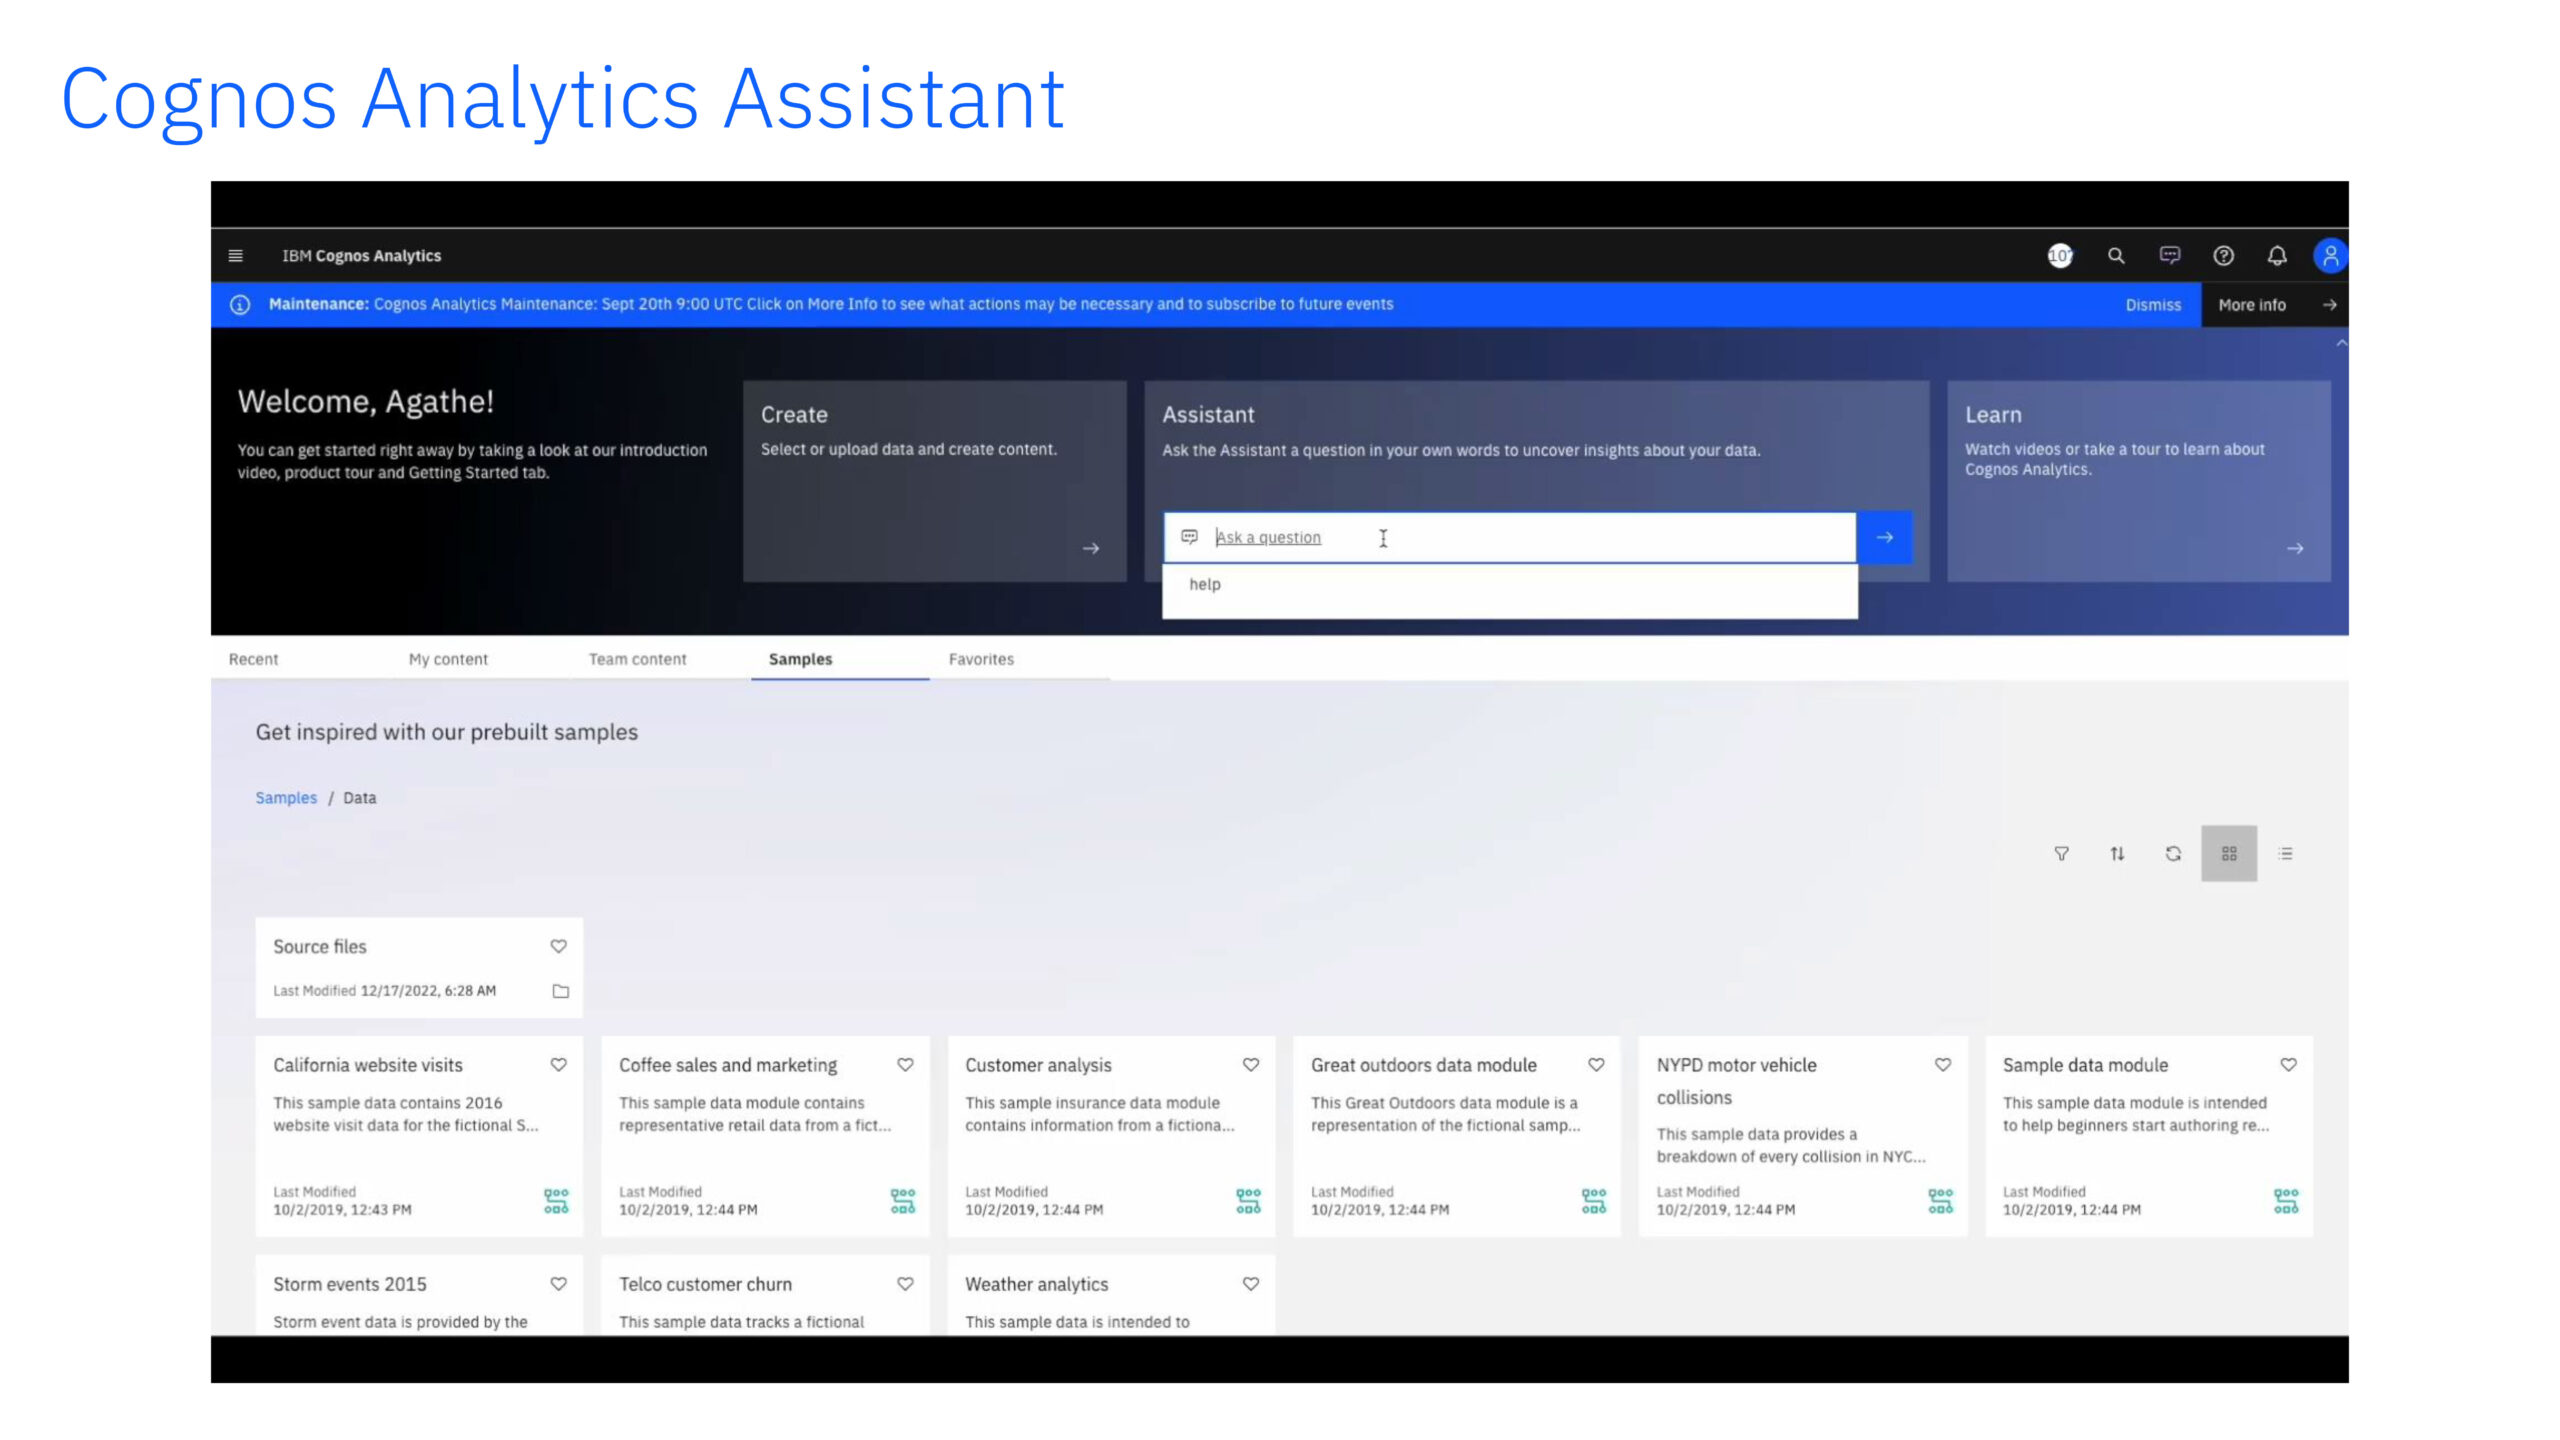
First, the Assistant. Pick your data, ask a plain-language question (“show revenue by city”), and let Cognos propose a chart you can evolve in a couple of clicks. When something looks promising, turn it into a full dashboard and keep building.
![]()
![]()
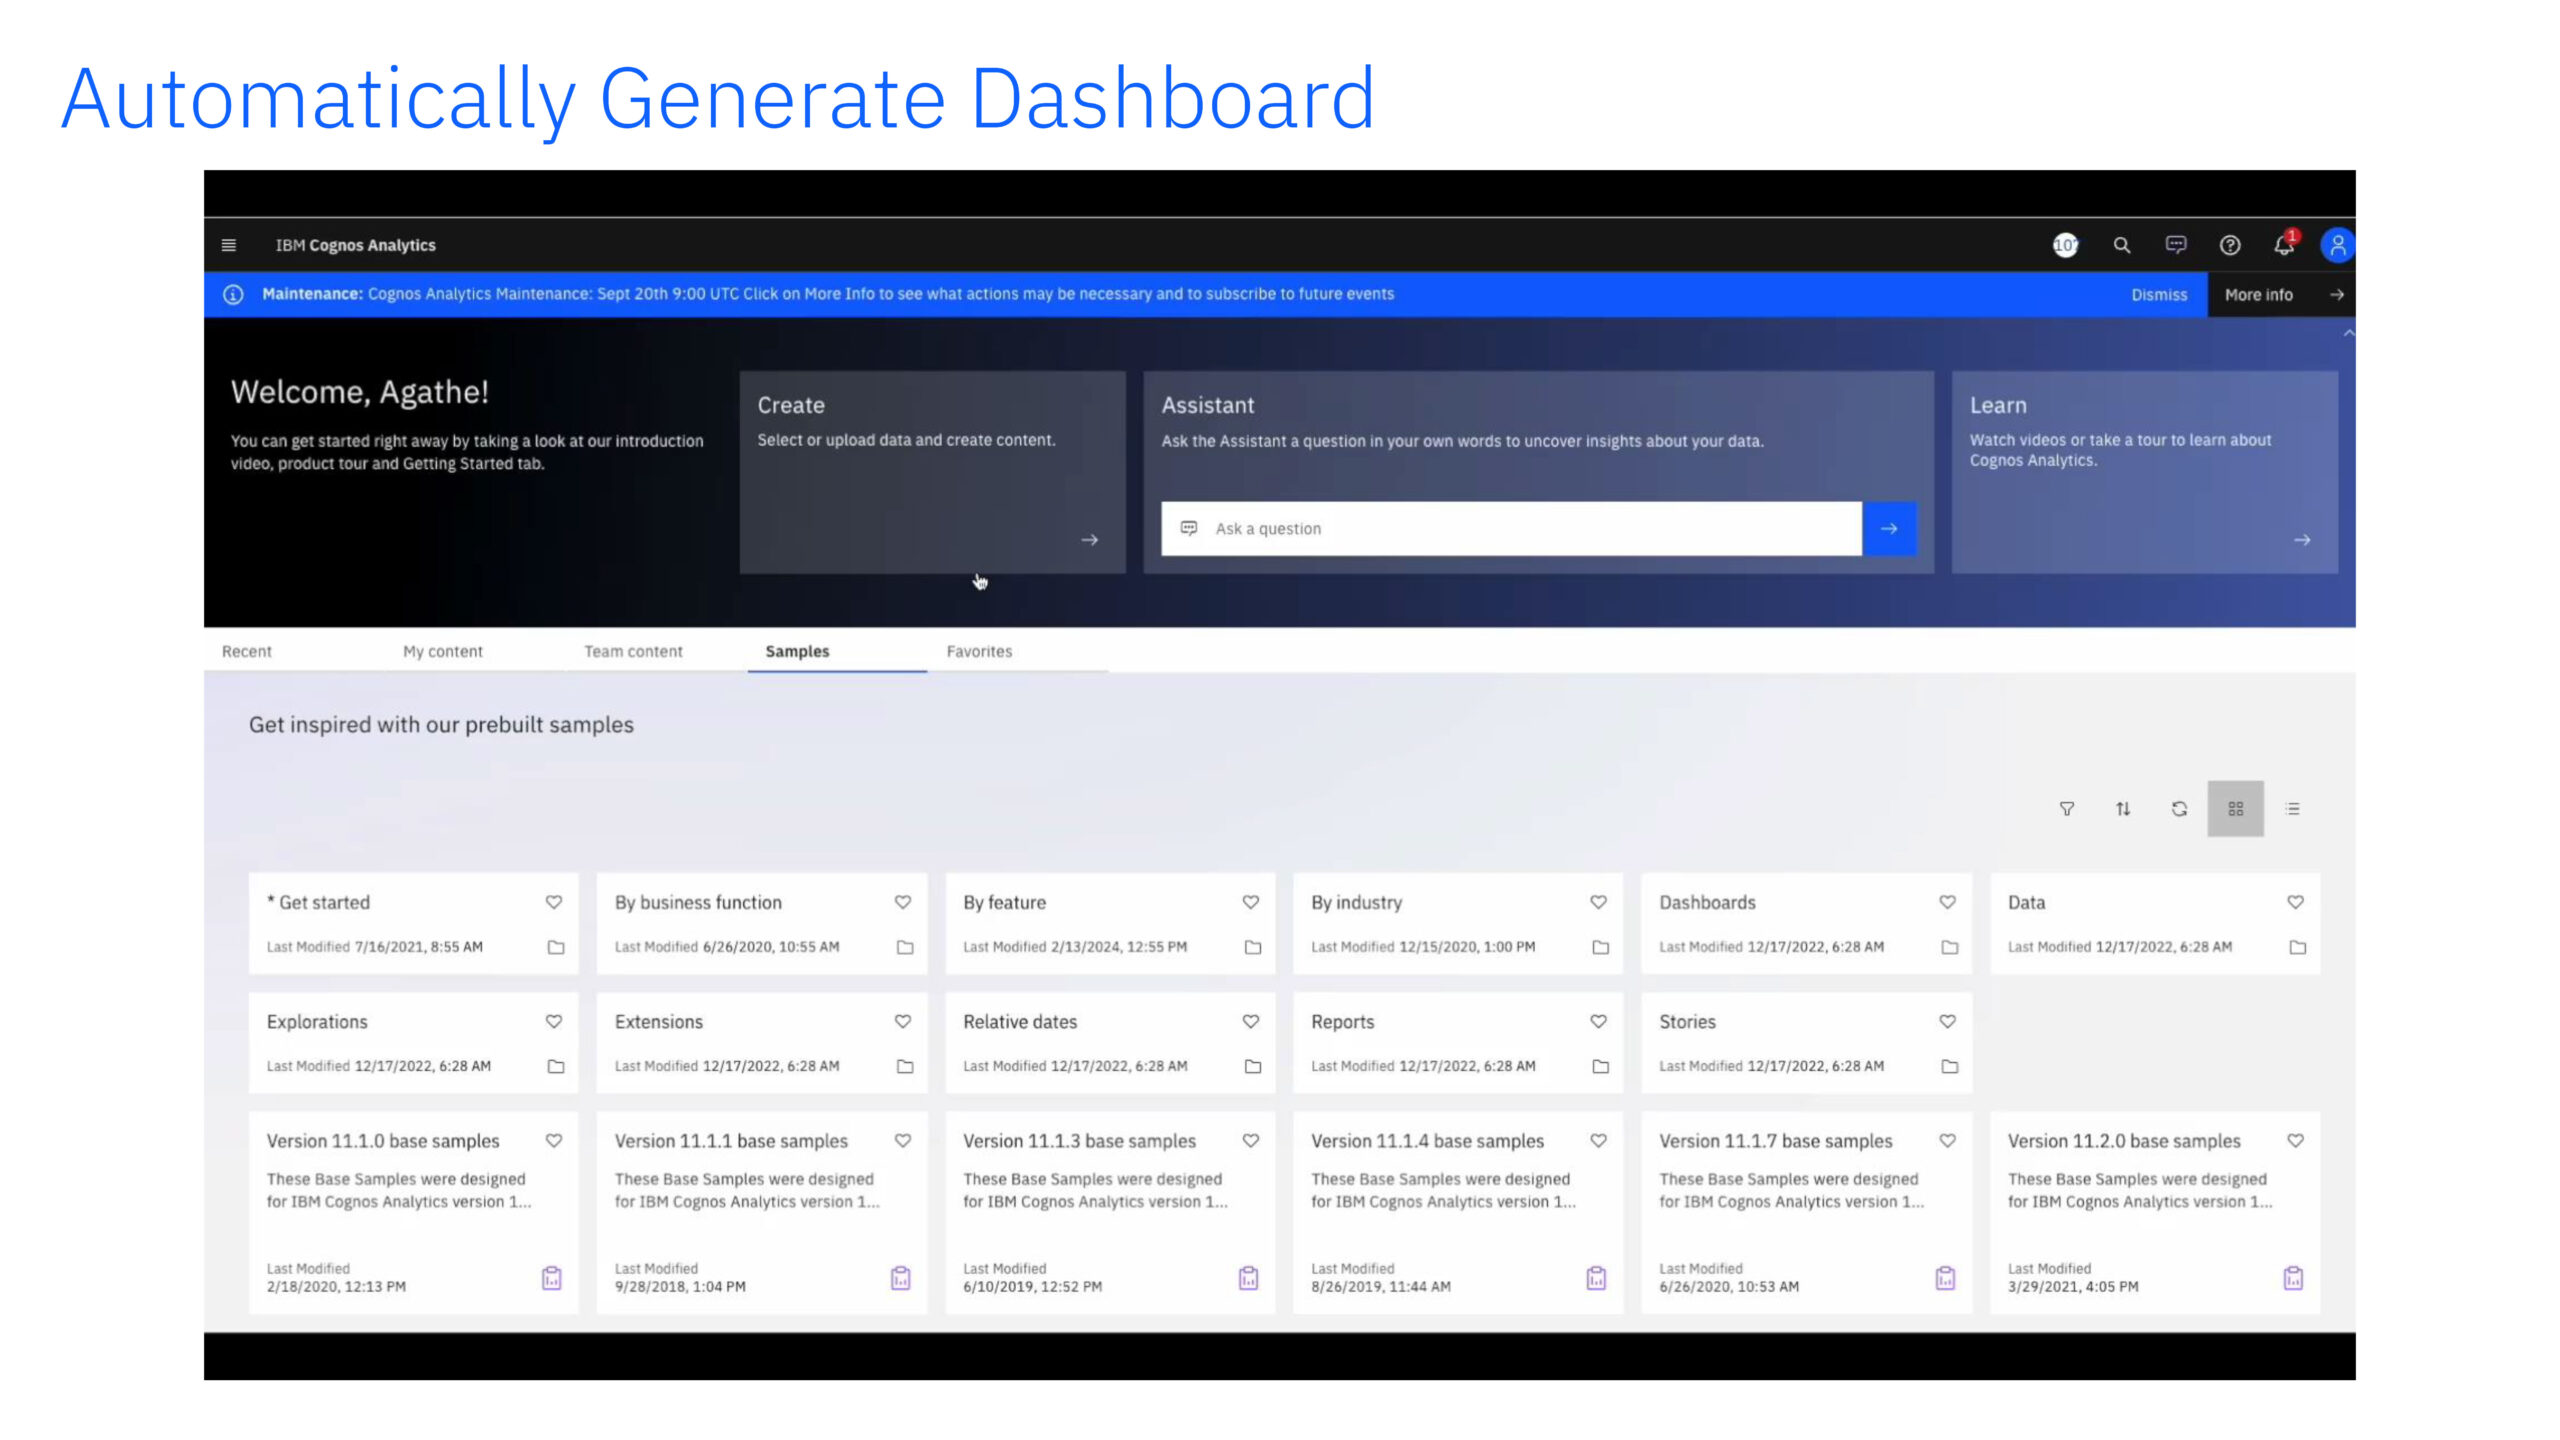
Prefer a head start you can prune? Use Create > Generate dashboard. Cognos lays out a sensible multi-tile view—KPIs, trends, breakdowns—so you can edit what’s there instead of assembling everything from zero. Delete what you don’t need, keep what you do, and you’ve saved yourself half an hour right away.
Make It Yours!
(interactivity that actually helps)
![]()
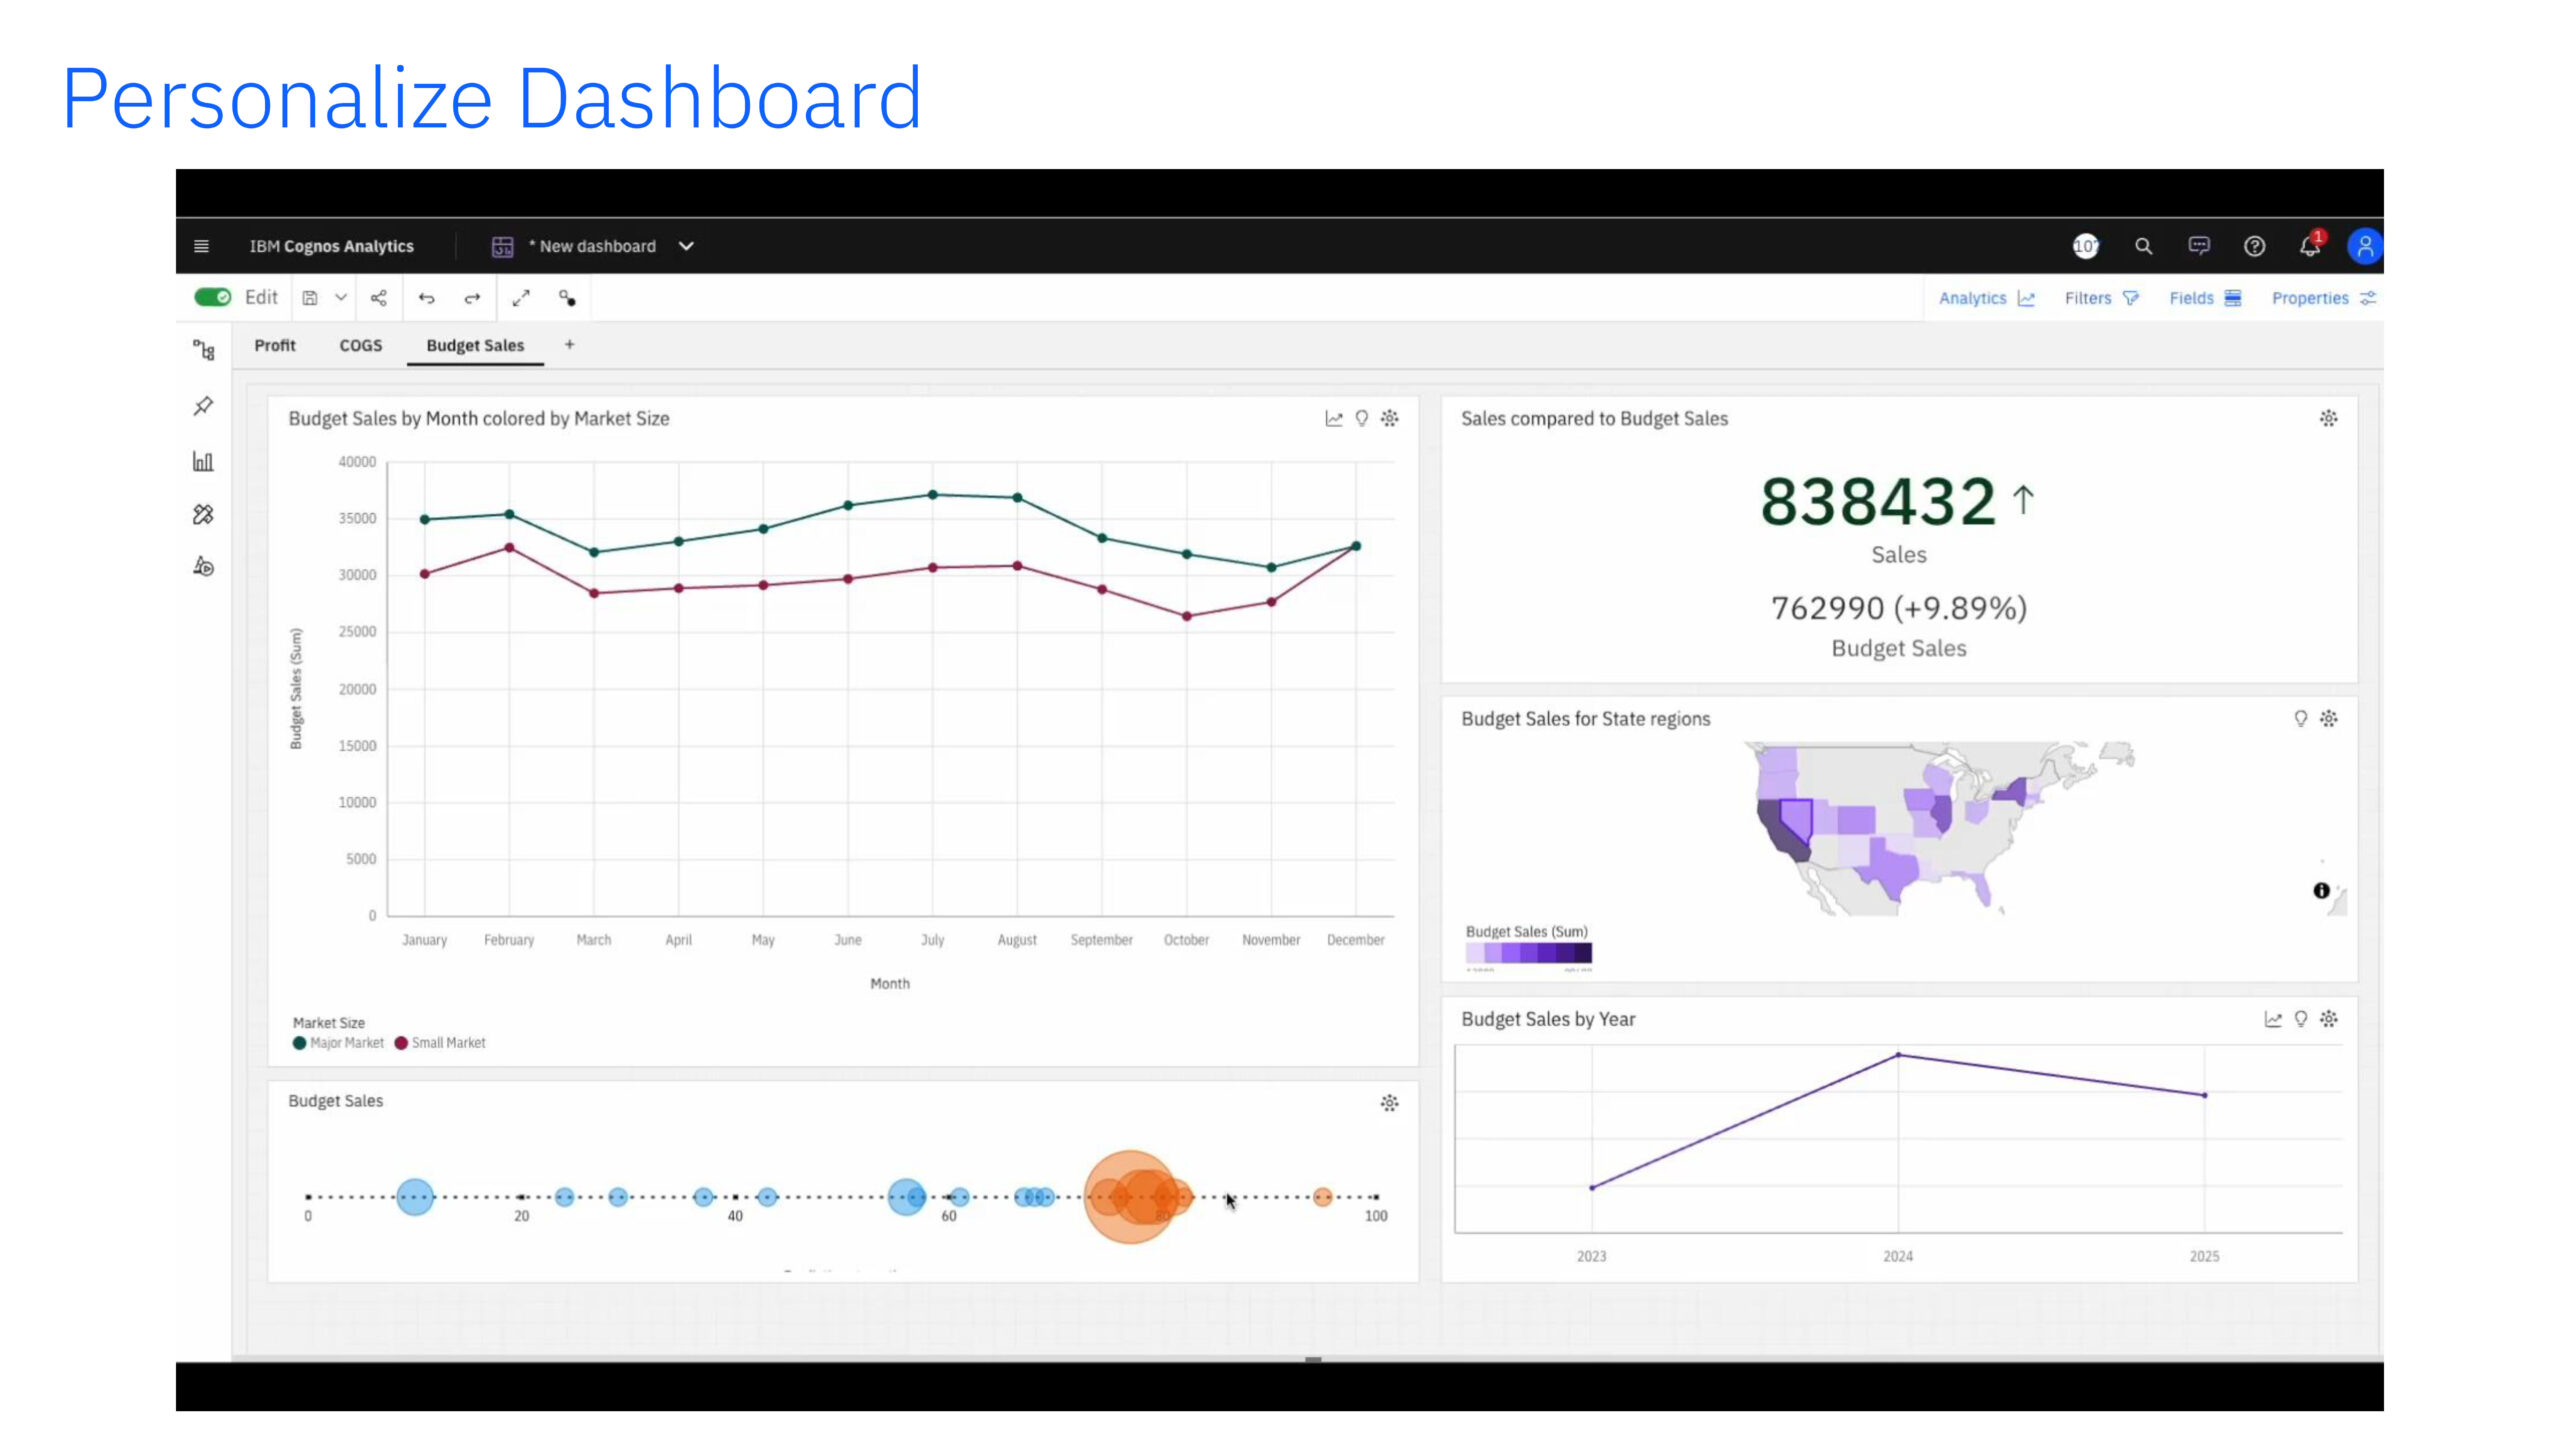
![]()
Think of a dashboard like a conversation at a table. When you point to one topic, everyone else leans in on that same topic. When you need a steady backdrop, you keep one page open while the discussion moves on.
Here’s how that feels in practice:
You open a sales dashboard showing products, regions, a trend line, and a customer list.
You click Beverages in the product list. Instantly, the trend line, region chart, and customer list all switch to
show Beverages only.
You didn’t run a new report; the page simply followed your lead.
Now you want less noise.
You change the product list to Top 10.
Everything refocuses on the few items that move the needle, not the many tiny ones.
You also want a steady reference.
Set the map as an anchor so it stays put while you explore; the rest of the page updates around it.
Finally, you zoom in time.
Start at Year > Month > Weekday to see exactly when a spike happened.
You add a subtle rule that highlights any margin under 10%, and you abbreviate big numbers
(1,200,000 J 1.2M) so the story reads at a glance.
That’s the idea: small, on-the-spot tweaks—focus on the biggest items, keep one view steady, zoom when you’re curious—turn a static page into a guided narrative. You spot what changed and learn why in the same place, without rebuilding filters or asking for a new report.
What’s Next On The Roadmap
![]()
![]()
The team is leaning into quality-of-life improvements that make everyday work smoother.
Bookmarks & saved views:
Authors can ship named views (think “Executive” or “North America”), and consumers can save their own filter states—no more rebuilding context every time.
Export, phase one:
Get the data behind visuals directly from the dashboard, including multi-select to export several widgets at once.
Filter panel polish:
Cleaner, collapsible filters so your content gets more room to breathe.
Smoother authoring:
Drag-and-drop feels snappier, with ongoing performance work to keep big dashboards responsive.
As always, roadmap items can evolve, but the direction is clear: faster starts, cleaner edits, and easier sharing.
Where Watsonx BI Fits
If you’re exploring natural-language analysis, Watsonx BI sits alongside Cognos to let you ask questions of governed data and get back answers you can act on. Think of it as another way into your insights—especially useful for business users—while your modeled Cognos content keeps everyone anchored to the same definitions.
For Quickstart Customers
QuickStart is powered by IBM Cognos Analytics, so these improvements land right where you work. Use generated dashboards to kickstart new views, lean on the Assistant for one-off questions, and share saved views so finance, sales, and operations stay aligned without rebuilding filters every time.
Ready to see it in action?
Book a 20-minute walkthrough and to see for yourself!