Streamline Financial Decision-Making: Unveiling Board of Director Reporting for QuickStart’s GL Financial Solution in SAP B1
Posted by Corey Mendelsohn on July 25,2023

Home - Blog - Streamline Financial Decision-Making: Unveiling Board of Director Reporting for QuickStart’s GL Financial Solution in SAP B1
Making smart financial decisions is essential for any business—especially during these uncertain times. Businesses must be able to quickly evaluate the health of their company and make informed decisions on how to plan for growth and manage cash flow. With our newest GL Financial reporting update from QuickStart for SAP B1 powered by IBM Cognos Analytics & IBM Planning Analytics, you can do just that! We’re excited to introduce “BOD” Board of Director Reporting as an additional feature allowing you better insights into your financials so you have more time to focus on other areas of your business.
Keep reading to get a full understanding of what this reporting feature has in store for your organization, along with high level snapshots of what this cutting-edge GL financial solution looks like!
Save Time and Start Analyzing in Just a Few Clicks
Introducing our latest enhancement to the GL Financial Solution: BOD DECK financials. This reporting addition includes Profit and Loss (P&L) statements, latest estimates, and other financial highlights showcasing the immense potential of NewIntelligence’s financial reporting capabilities. Not only does it help customers save precious time, but it also offers a meticulously organized approach to reporting.
Instead of spending valuable hours creating these financial reports from scratch, customers can rely on NewIntelligence’s GL Financial Reporting solution. With just a few clicks, they can effortlessly access the desired report and dive into data analysis. Say goodbye to wasted efforts and say hello to efficiency and convenience.
Revolutionizing Financial Reporting in SAP Business One: An Intuitive and Streamlined Approach
Determine the shortcomings of traditional financial reporting in SAP Business One and unlock a game-changing solution. At NewIntelligence, we understand the frustrations that come with complex and unintuitive reporting methods. That’s why we’ve developed a cutting-edge solution to revolutionize the way you handle financial reporting.
Our pre-created version of a reporting sheet is purposefully designed to simplify and streamline your financials like never before. With just a few simple clicks, you’ll have access to a comprehensive overview of your company’s information across various periods.
Finally, financial reporting that is easy to understand and effortlessly retrieve.
Simplify your processes and embrace a user-friendly analytics perspective for your GL Financials. Join us on this transformative journey and revolutionize the way you approach financial reporting with SAP Business One.
Get the Full Picture of Your Profits and Loss Tracking
Take control of your financial data with our advanced Profit and Loss (P&L) reporting feature from our GL Financial BOD. Easily analyze year-to-date and monthly performance, make informed decisions with the latest estimates, and zoom in on specific cost centers. Additionally, our drill-through feature allows you to delve deep into GL accounts for comprehensive insights.
Take a glimpse at the possibilities below:
Our pre-created reports are designed to provide our clients with a clear understanding of their actual financial performance compared to their budget.
With these reports, companies can easily analyze their cost of goods sold, gross profit, and more, enabling them to stay on track with their goals and commitments.
Furthermore, our reports offer flexibility as companies can choose the time period they prefer to review their financial data.
From sales to logistics, these reports also highlight the actual versus budget comparison, shedding light on total expenses and ensuring alignment with planned objectives. With our comprehensive reports, you are gaining valuable insights into your financial performance.
Analyze the Latest Estimates
Stay informed with the latest estimates of your company’s sales expenses and logistics by analyzing the P&L of your business.
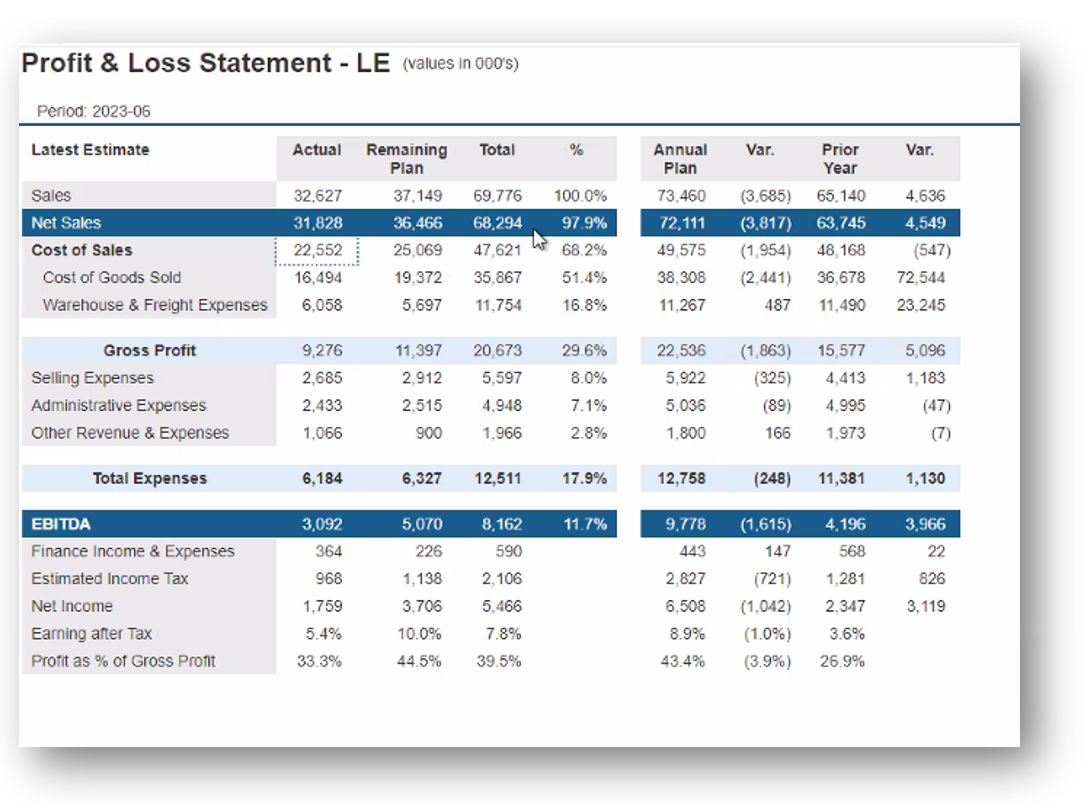
Take a look at a preview of the reporting feature for Profit & Loss Latest Estimates below:
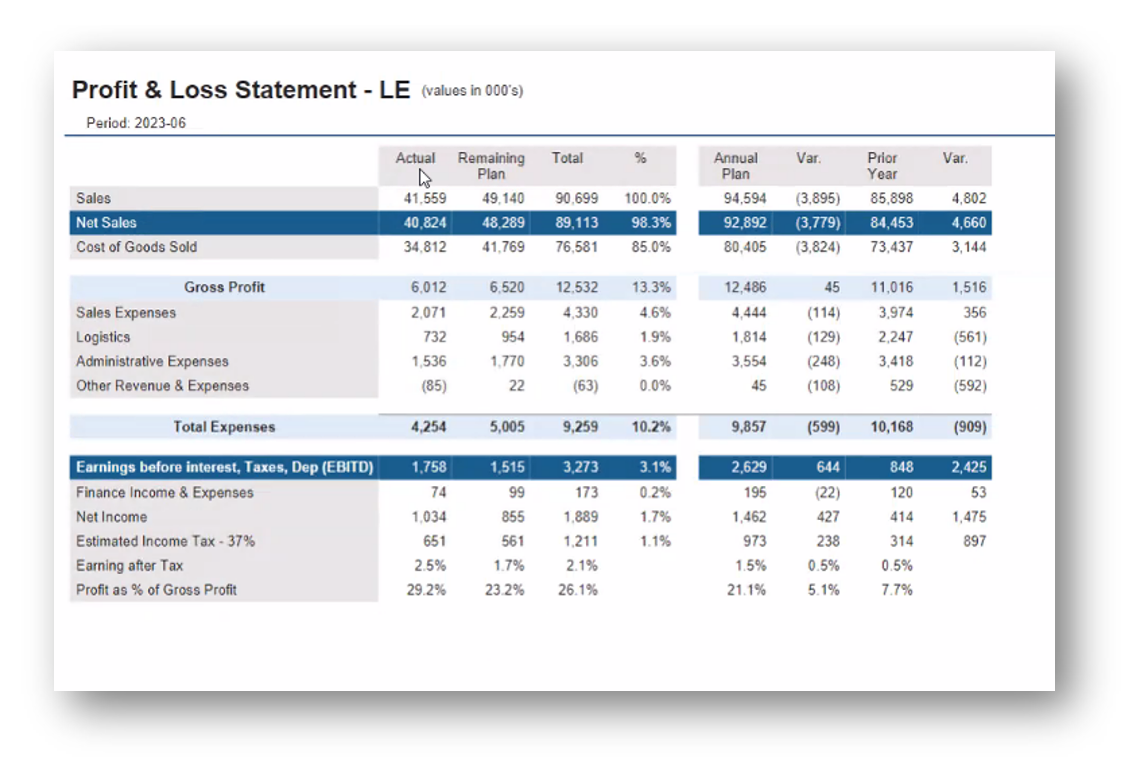
The diagram above provides a snapshot of highly detailed information of your P&L in terms of your latest statement. Above, you can see the past six months of a fictional customer’s plans and budgeting. Their overall plan (Annual Plan) was set at $94M ($94,594,000.00).
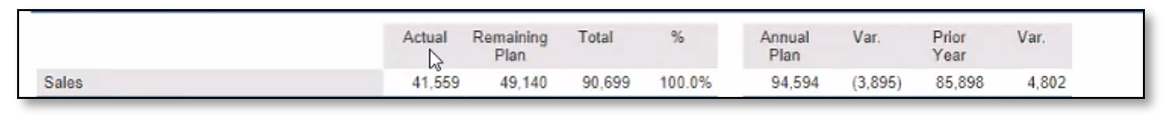
Currently, their sales are trending at $90M which places them $3.8M below their initial budget. However, compared to last year’s performance of $85M, they are actually experiencing growth.
Upgrade your financial reporting capabilities with our cutting-edge GL Financial reporting solution. Seamlessly compare data from multiple periods in SAP B1 to gain valuable insights that were once hard to come by. Now, you can effortlessly gather and analyze multiple sources of data, all in one place. Take control of your financial planning and optimize your business strategies like never before.
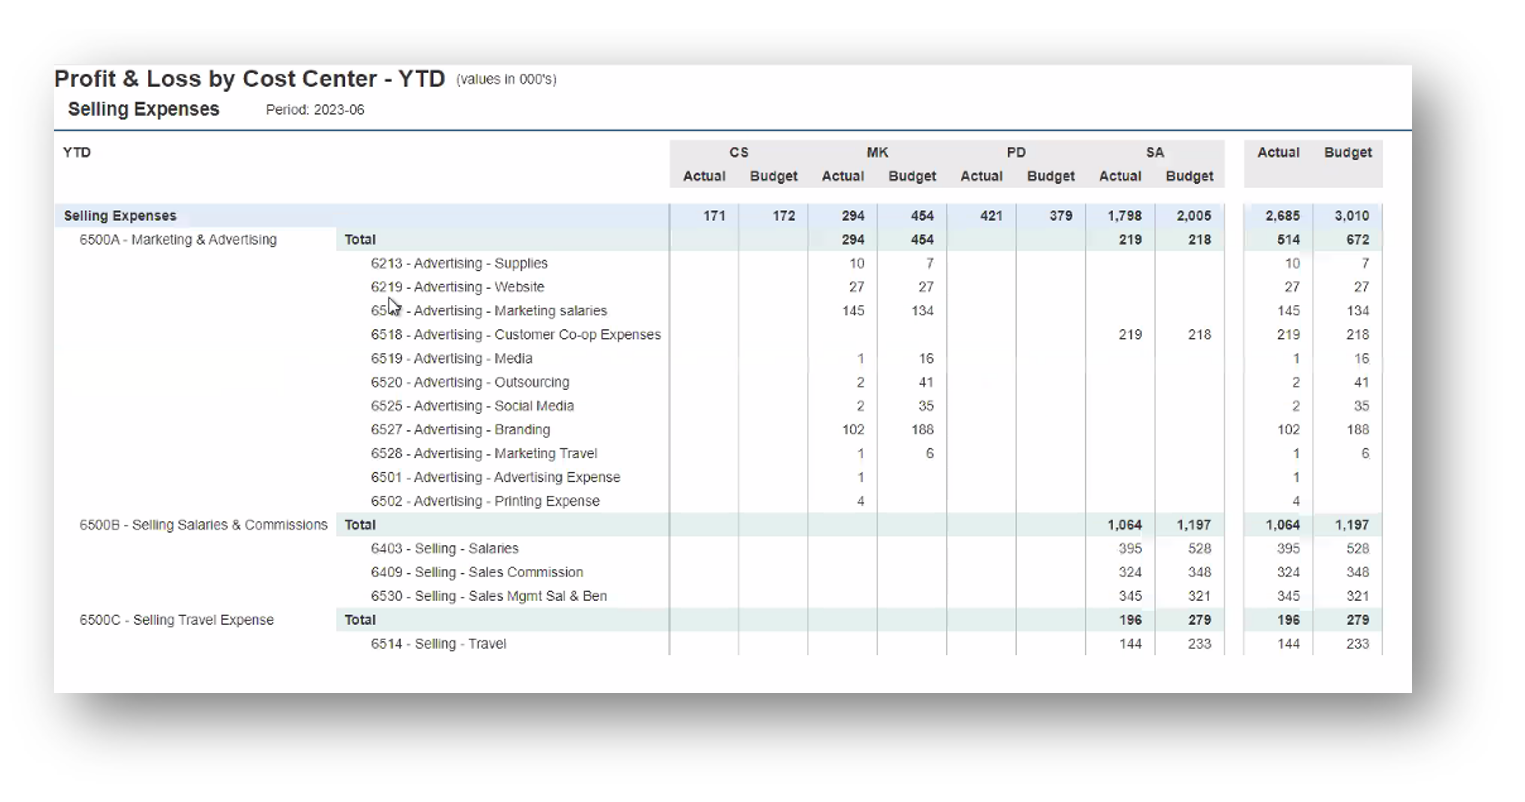
Explore a More Interactive Option for Your Company’s Planning
Discover a flexible and engaging solution that allows you to see your actual data, compare it to your plan, and examine variances. This option also includes a powerful drill-through capability for a deeper analysis. See below for more.
As an example for this interactive capability, in the following diagram, observe the selling expenses of $302K compared to the planned amount of $478K.
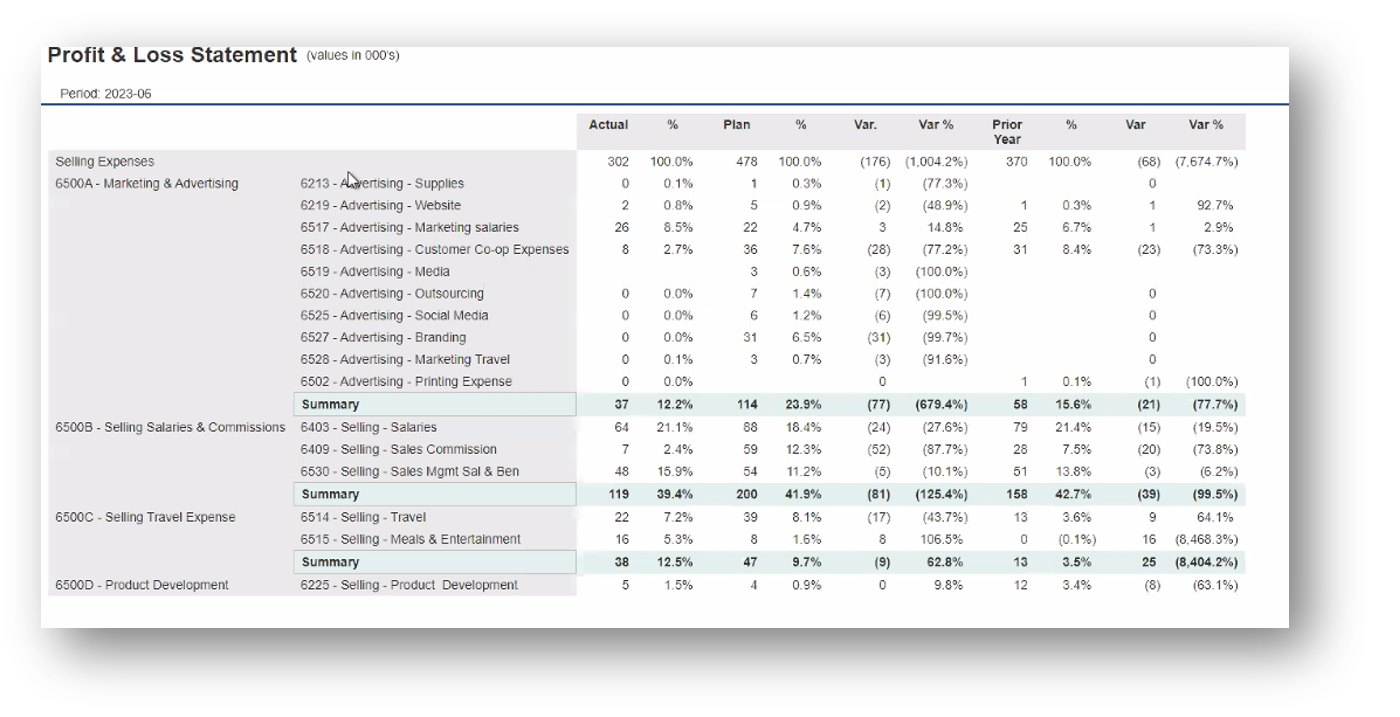
This fictional case demonstrates how the company spent less than expected or budgeted, with last year’s expenses totaling $370K.
By reviewing the detailed table, you can easily pinpoint where your funds were allocated and where the budget was allocated. For instance, marketing and advertising expenses amounted to $37K, while the budget was set at $114K.

Delve into the specific details and variances, such as a $77K difference in the marketing and advertising category. Our drill-through capability enables you to start at a higher level and effortlessly navigate to the GL account code to uncover what exactly contributed to these variations. Click through various areas to monitor and analyze the data you need.
With our solution, you can analyze your company’s financial data with ease and precision.
Taking a closer look at the YTD (P&L) analysis.
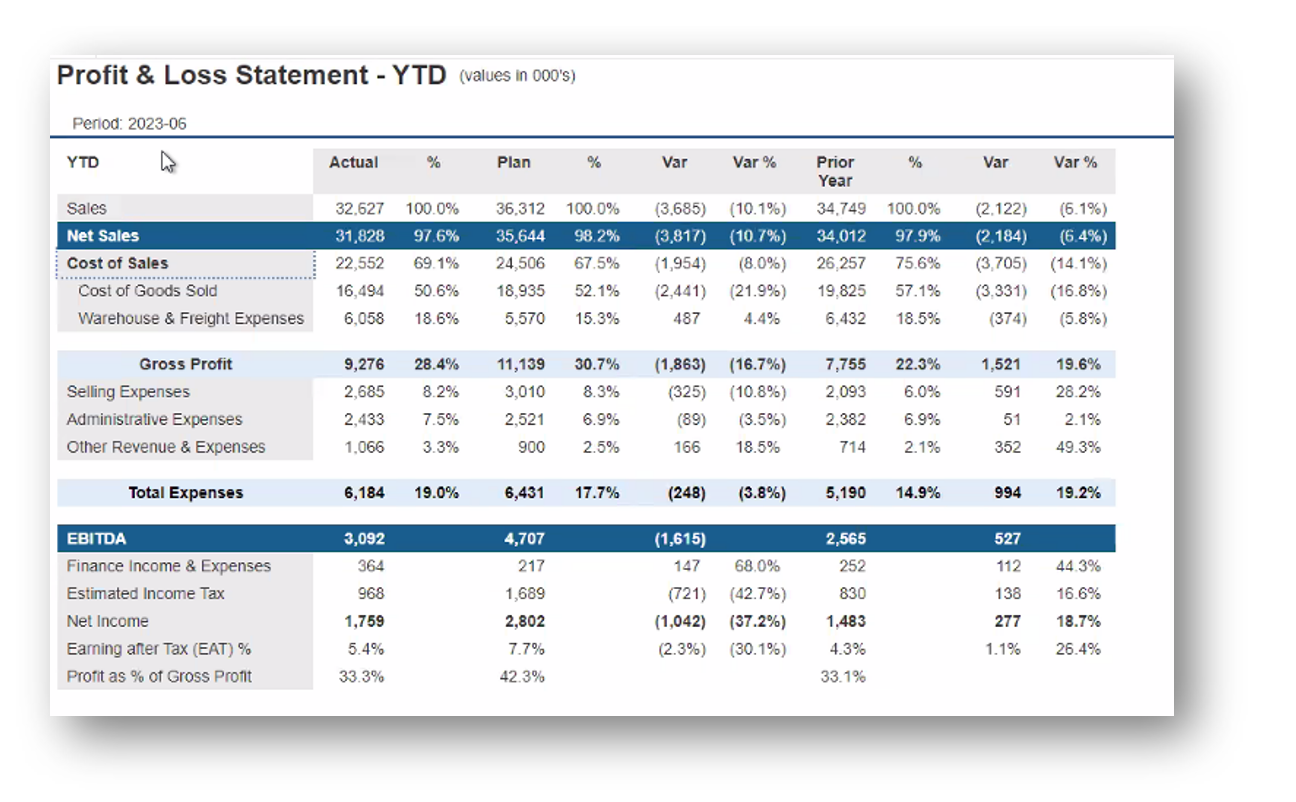
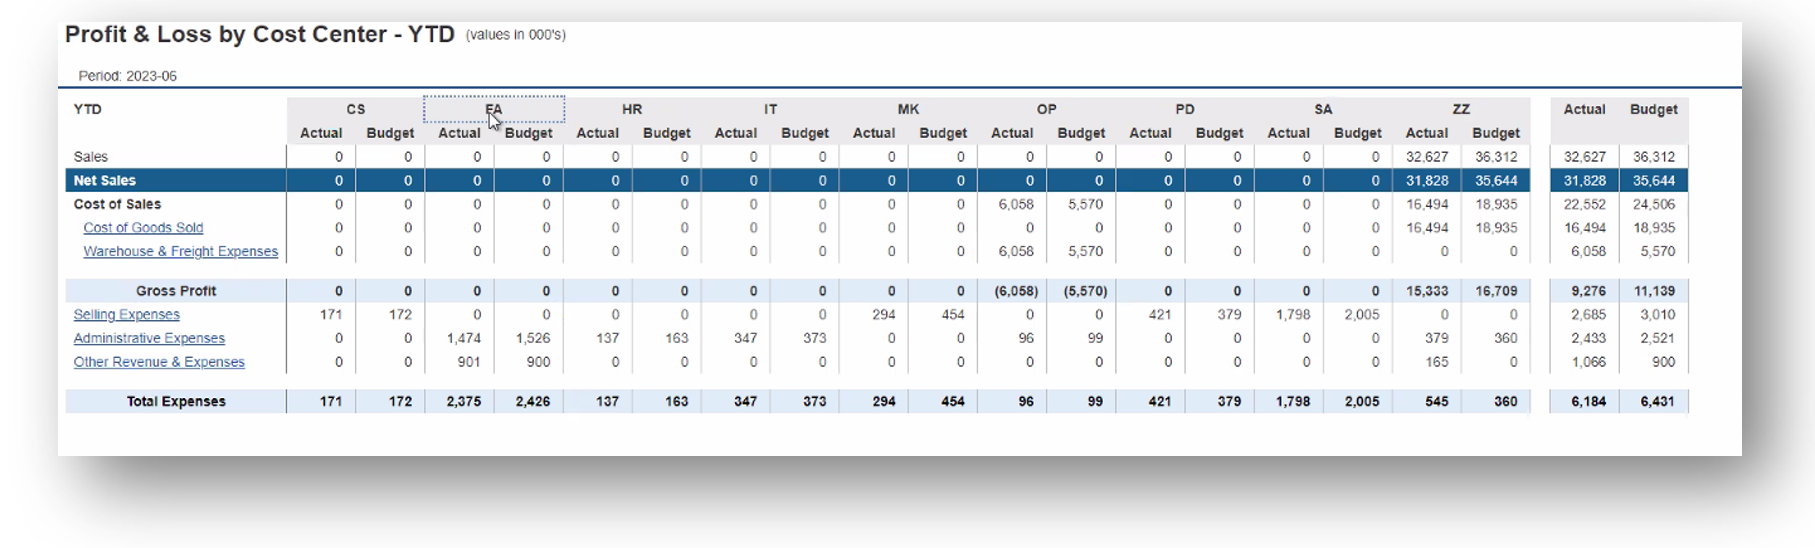
In the diagram above, we show you an example of Profit & Loss, which can be analyzed “Year to Date”. Here you can see the revenue of $32,6M, which is lower than the planned amount of $36M. This means there was a shortfall of $3.6M. Comparatively, in the previous year, the revenue was $34,7M.
By examining the P&L perspective, we can assess the variance between the plan, last year’s performance, and the latest estimate. This continues to provide beneficial insights into the financial situation.
Below you can review the Latest Statement of P&L:
Another example showcases the enhanced reporting capabilities that enable companies to delve into their financial processes with precision and clarity, as per the P&L for the Latest Statements. Experience the power of drill-through functionality for a deeper understanding of the finer details.
Experience Full Visibility: A Monthly Breakdown of Profit and Loss
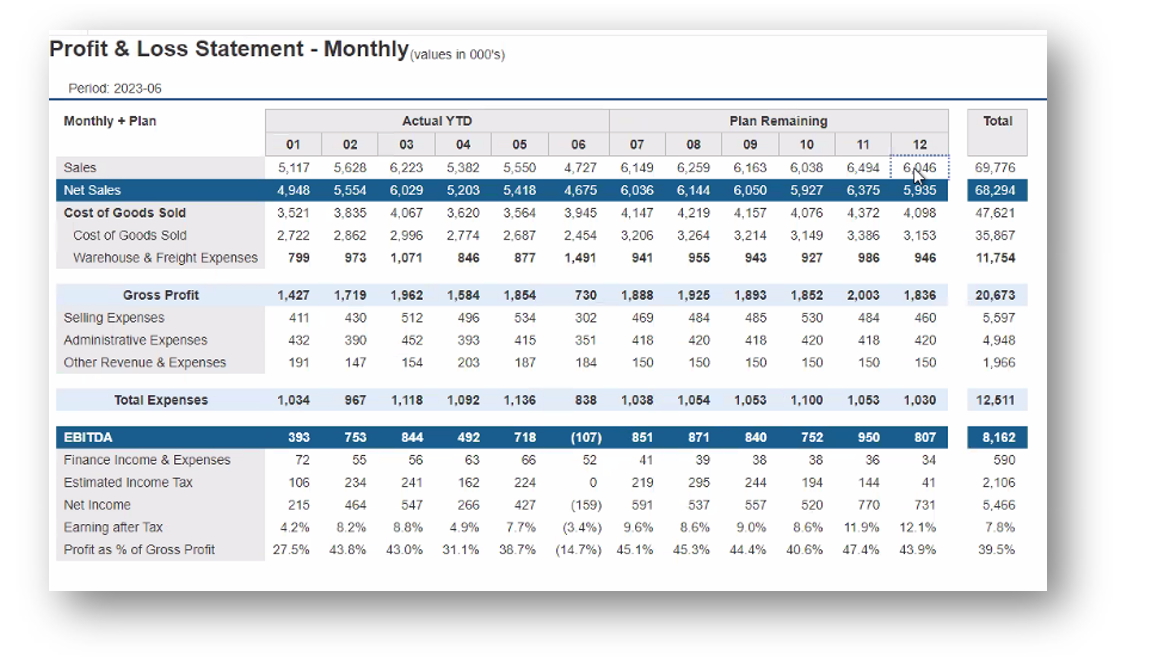
Observe in the diagram above, a clear and comprehensive view of a company’s performance through this lens into P&L. As you can see, this feature allows the user to compare actual results with planned projections, enabling you to confidently track your progress on a monthly basis.
Based on the diagram, it is projected that the sales will reach an impressive $69M by the year-end.
Get complete visibility into your earnings and profitability with our invaluable insights pulling data from your SAP Business One environment.
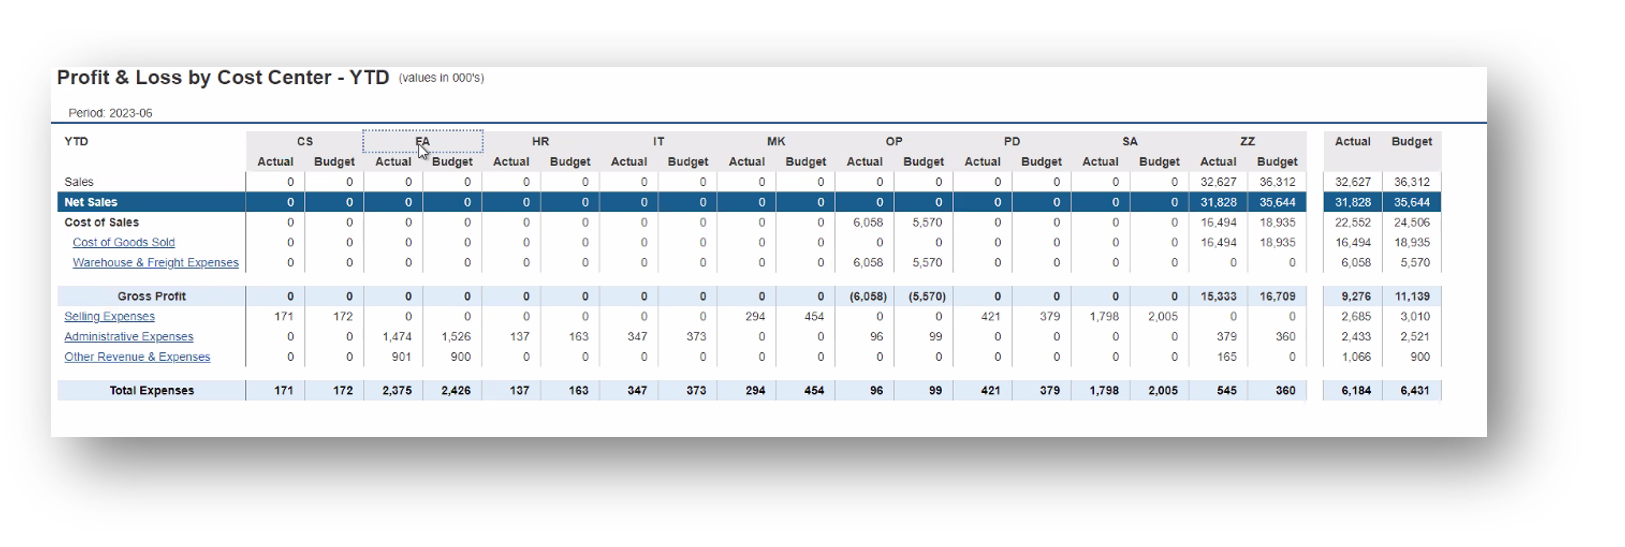
Discover the Power of Cost Center Analysis for Your Financial Statements
When it comes to understanding your financial statements, there’s another valuable perspective you can explore: Cost Center Analysis. By diving into the cost center reporting section, you’ll gain insights into sales information year to date, with the top codes indicating relevant cost centers like IT, Marketing, Operations, HR, and more.
But that’s not all. With this approach, you can also perform a drill through analysis by cost center, allowing you to dig deeper into sales data and selling expenses with specific GL account codes.
Unlock the full potential of your financial data by leveraging the power of cost center analysis. See an example below:
With our GL Financial Reporting Solution, all your financial data is right at your fingertips! With a simple click of a button, you can access the information you need and dive into the details that matter most.
No more wasting time collecting and formatting data from SAP Business One and Excel. Our automated process saves you valuable time, allowing you to focus on analyzing the numbers and gaining insights for better business decisions.
At NewIntelligence, we’ve made it effortless for people at all levels of the business to access information instantly, at any point in time without requiring third-party assistance. This means you can quickly spot potential issues and mitigate risks through thorough analysis.
Stop wasting time and start analyzing with ease. Get our GL Financial Reporting Solution today and take control of your financial data.
Conclusion
QuickStart’s Board of Director Reporting for GL Financial Solution in SAP Business One is a powerful way to streamline the financial decision-making process. Instead of spending valuable hours creating these reports from scratch, customers can rely on NewIntelligence’s GL Financial Reporting solution which is also powered by IBM Cognos Analytics & IBM Planning Analytics allowing advanced analytic capabilities. QuickStart provides an intuitive and streamlined approach for gaining insights into your company’s sales expenses, logistics, and staying informed with recent estimates. Furthermore, it provides companies with drill-through capability for greater interactivity during financial planning. Our reporting solution also offers full visibility by any period you choose to examine and cost center analysis capabilities for your financial statements. Hence, if you’re seeking a faster and more efficient method of managing your finances, make sure to consider our revolutionized reporting solution in SAP Business One from QuickStart today!